
🔍 How to Open DevTools
You can open DevTools in several ways:
- Right-click on any element →
Inspect - Keyboard shortcuts:
- Windows/Linux:
Ctrl + Shift + IorF12 - macOS:
Cmd + Option + I
- Windows/Linux:
🧭 Overview of the Main Panels in DevTools
Here are the most commonly used tabs/panels:
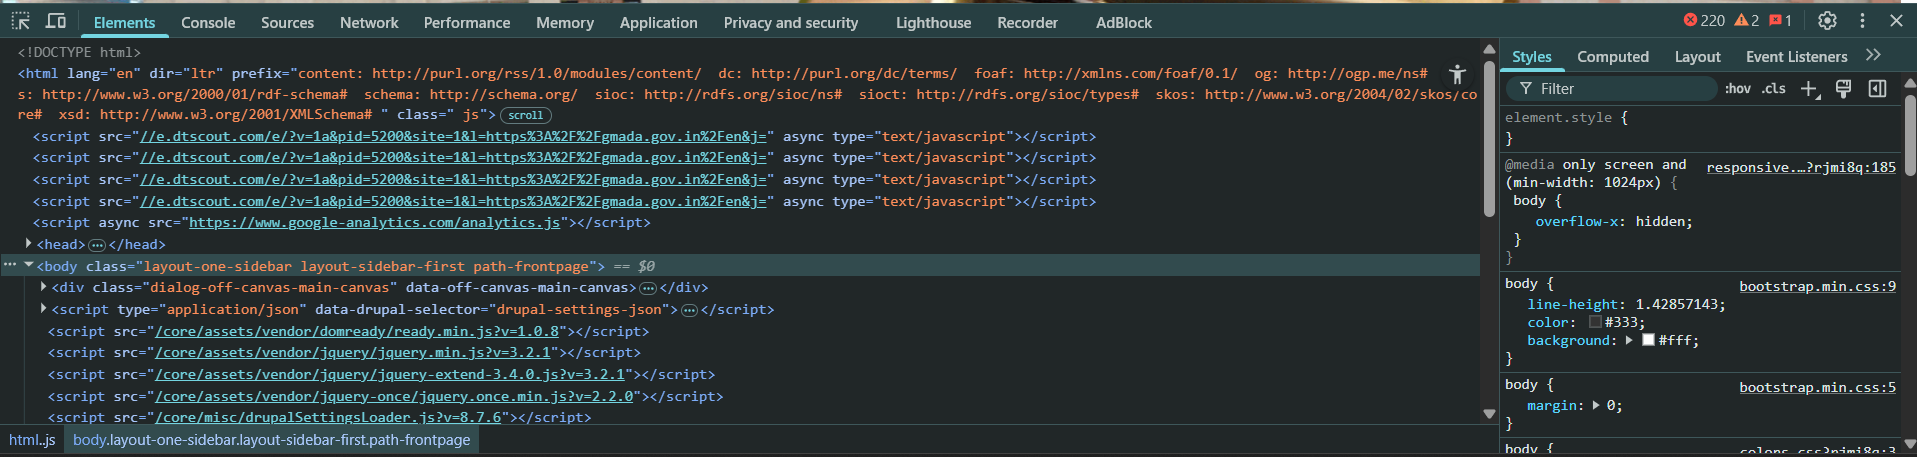
1. Elements
- What it does: Lets you inspect and edit the HTML and CSS of your page live.
- Use cases:
- Modify styles on-the-fly
- Test UI changes
- See which styles override others
- Copy selectors, view computed styles
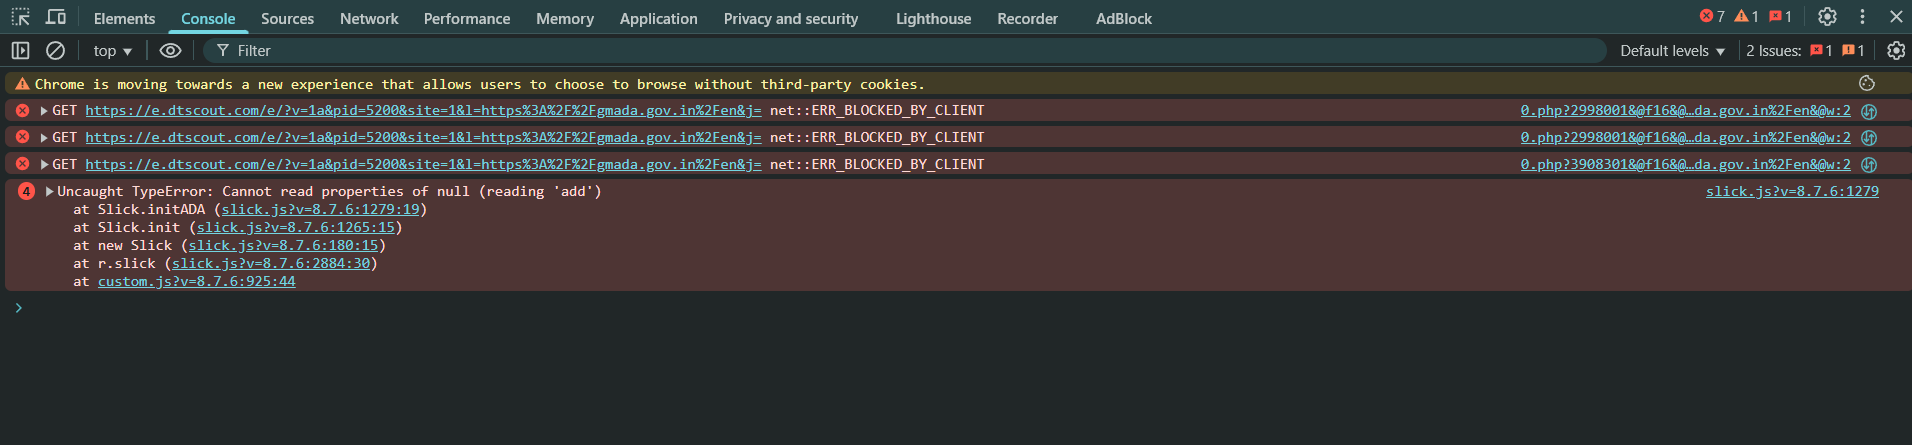
2. Console
- What it does: Shows JavaScript logs, errors, and lets you run JS code manually.
- Use cases:
- Debug scripts with
console.log,console.error, etc. - Try JavaScript snippets
- Interact with DOM via JS (
document.querySelector, etc.) The DOM is a programming interface for HTML and XML documents. When a browser loads a web page, it parses the HTML and creates a tree-like structure of objects that represent elements on the page. This tree is the DOM. Think of it as a live, interactive blueprint of your web page that JavaScript can read and manipulate.
- Debug scripts with
Console Filter Options – The Console Sidebar filter in Chrome DevTools, helps you organize and filter the types of messages shown in the Console tab — especially useful when your app logs tons of data.
🔹 Messages: Shows all messages (a combination of errors, logs, warnings, etc.). This is the default view and the most verbose.
🔹 User Messages: Only shows console.log(), console.info(), and console.debug() that were explicitly written by developers.
🔹 Errors: Shows only console.error() messages or thrown JavaScript errors.
🔹 Warnings: Shows only console.warn() messages.Typically used for non-breaking issues or potential risks.
🔹 Info: Shows only console.info() messages. Slightly less noisy than log, often used for status updates.
🔹 Verbose: Shows everything, including things that normally don’t show up like: Internal debug messages, Detailed fetch logs, Framework-level debug info, Great for in-depth debugging, but can be noisy.
🛠️ Other Powerful Features of the Console Tab
🔹 Live Expression Watch
Click + beside “Live Expression” to monitor a variable in real time.
Great for seeing values change while your app runs.
🔹 Run JS Directly
You can execute any JavaScript code in the console.
🔹 Console Commands ($0, $_, etc.)
$0 → the element currently selected in the Elements tab.
$_ → last evaluated expression result.
$1, $2, … → previously selected elements in reverse order.
$$(‘selector’) → shorthand for document.querySelectorAll()
🔹 Group and Trace Logs
console.group(‘Label’) / console.groupEnd() → organize logs
console.trace() → shows a stack trace of where a log was called
🔹 Timers
Great for profiling performance.
🔹 Clear Console
Use the ⛔ icon or Ctrl + L / Cmd + K to clear the log output.
🔹 Preserve Log
Enable this option to keep logs even after page refresh — useful for debugging page loads.
🔹 Pro Tips
Use console.table() to display arrays/objects in table format.
Use custom style
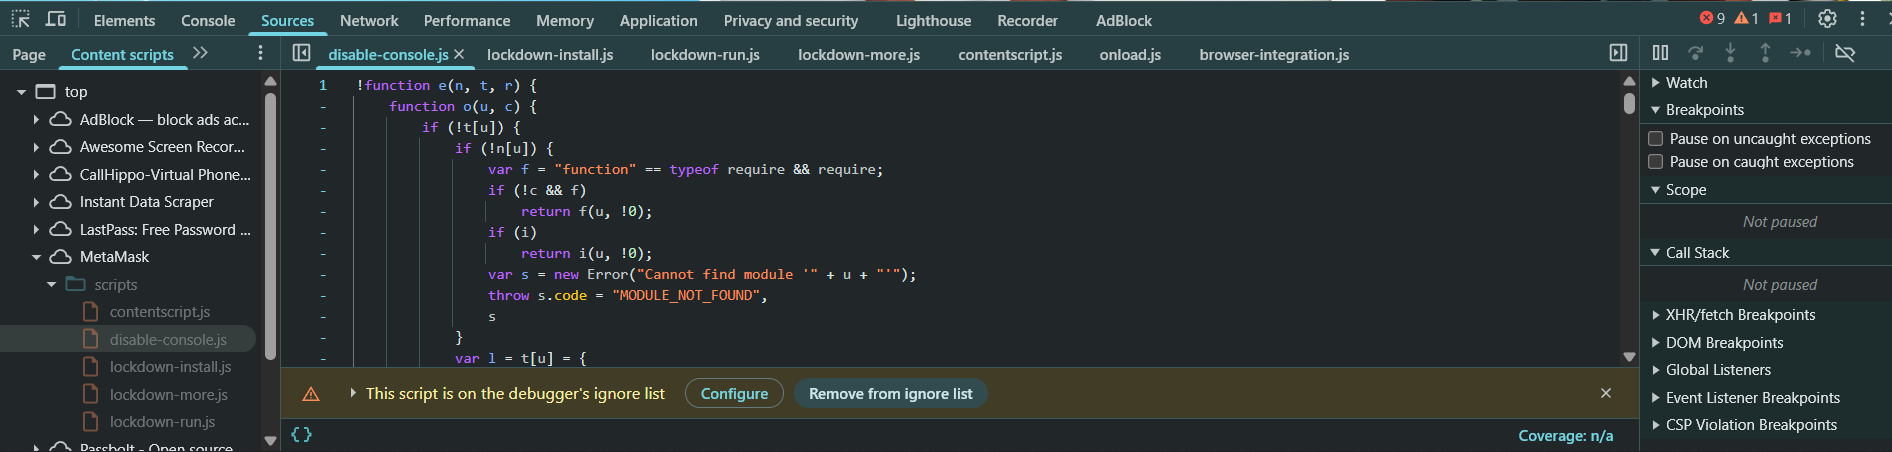
3. Sources
The Sources tab in Chrome DevTools, which is a powerful live code editor and debugger for JavaScript and frontend developers. Let’s break down what all those sections mean so you can use them effectively is split into 3 main parts:
- What it does: View and debug JavaScript files.
- Use cases:
- Set breakpoints
- Step through code line-by-line
- Watch variable values
- Use the Call Stack and Scope for debugging
📁 LEFT: Page & Workspace (File Navigator)
- Page Tab: Shows all the resources loaded by the current webpage, These are files that the browser loaded from the server. You can click any JS file here to open it in the middle panel and set breakpoints.
- HTML
- JavaScript
- CSS
- Images
- Fonts
- Filesystem / Workspace (Optional) : You can map your local project folder here.
- Allows live-editing and saving changes from DevTools directly to your local files — very handy for local development.
- Requires manual setup (right-click and “Add folder to workspace”).
🧑💻 MIDDLE: Code Editor
Displays the source file you’re currently inspecting. Here’s where you can:
- Set breakpoints
- Add logpoints
- Edit files (temporarily)
- See in-line execution flow during debugging
🛠️ RIGHT: Debugging Tools
This is where the magic of debugging happens. Let’s break each section down:
- Watch
- You can manually enter expressions or variable names to monitor.
- Helps you track values live as you step through code.
- Breakpoints
- Lists all your active breakpoints.
- You can disable or delete them from here.
- Super useful for keeping track of complex debugging sessions.
- Call Stack
- Shows the stack of functions that led to the current line of execution.
- Helps you trace how a function was called — like a breadcrumb trail.
- Scope
- Shows all variables currently in scope (local, global, closure).
- Lets you inspect the real-time values during debugging.
- Break on… (Right-click DOM in Elements tab): Triggers breakpoints when:
- DOM is modified
- Attribute is changed
- Element is removed
- Very handy for debugging DOM-based behavior.
🔁 Typical Debug Workflow
- Open Sources tab
- Navigate to
main.jsor similar from the Page panel - Set a breakpoint on a suspicious line
- Trigger that part of the code (e.g., click a button)
- When it pauses, check:
- 🔍 Watch variables
- 🧭 Call Stack
- 🧮 Scope
- 🔁 Step through (
F10,F11, etc.)
- Fix or tweak logic based on what you see
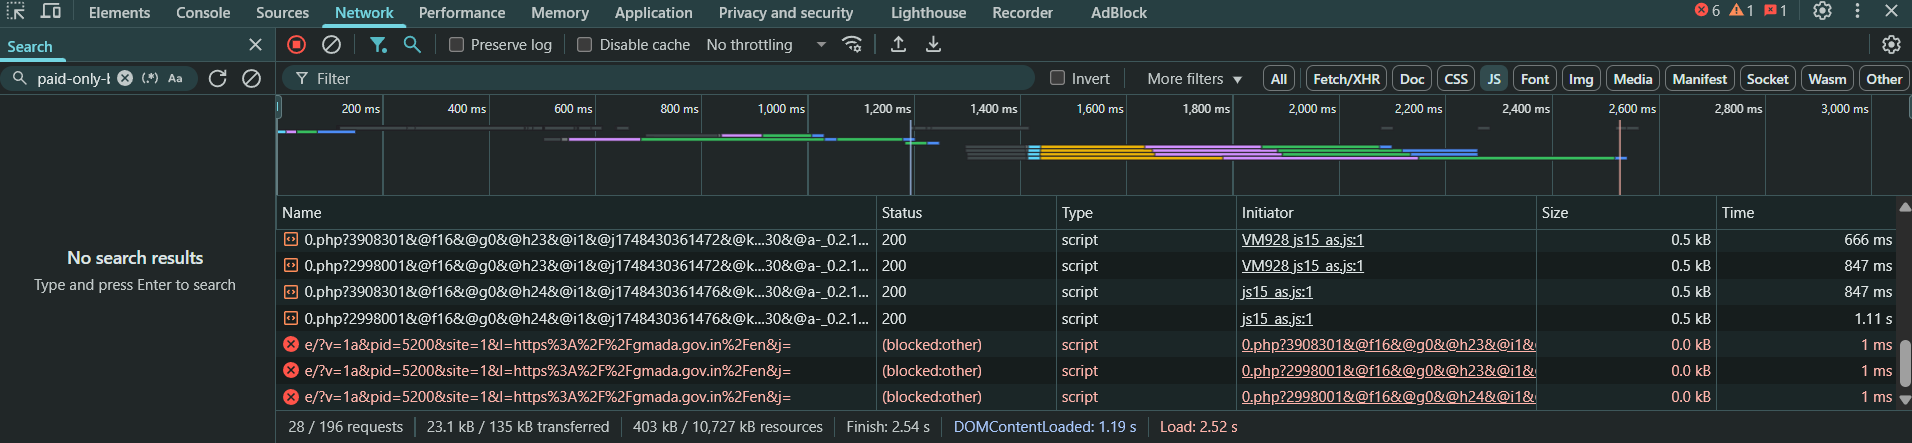
4. Network
- What it does: Logs every HTTP/HTTPS request made by the page.
- Use cases:
- Inspect API calls (headers, responses, payloads)
- Analyze loading speed
- Detect failed resources (404s, 500s)
- Check caching (status code
304)
5. Performance
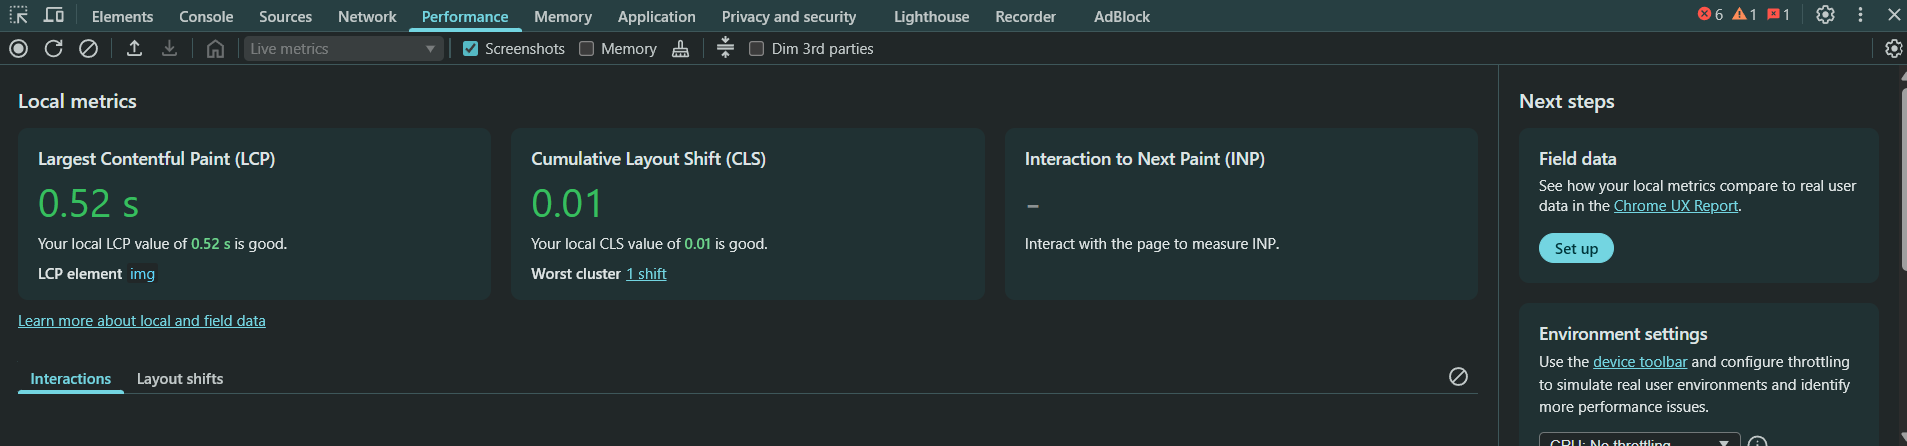
- What it does: Records and analyzes the page’s runtime performance.
- Use cases:
- Identify slow parts of your app
- Analyze FPS, scripting, rendering
- Spot memory leaks or jank
6. Application
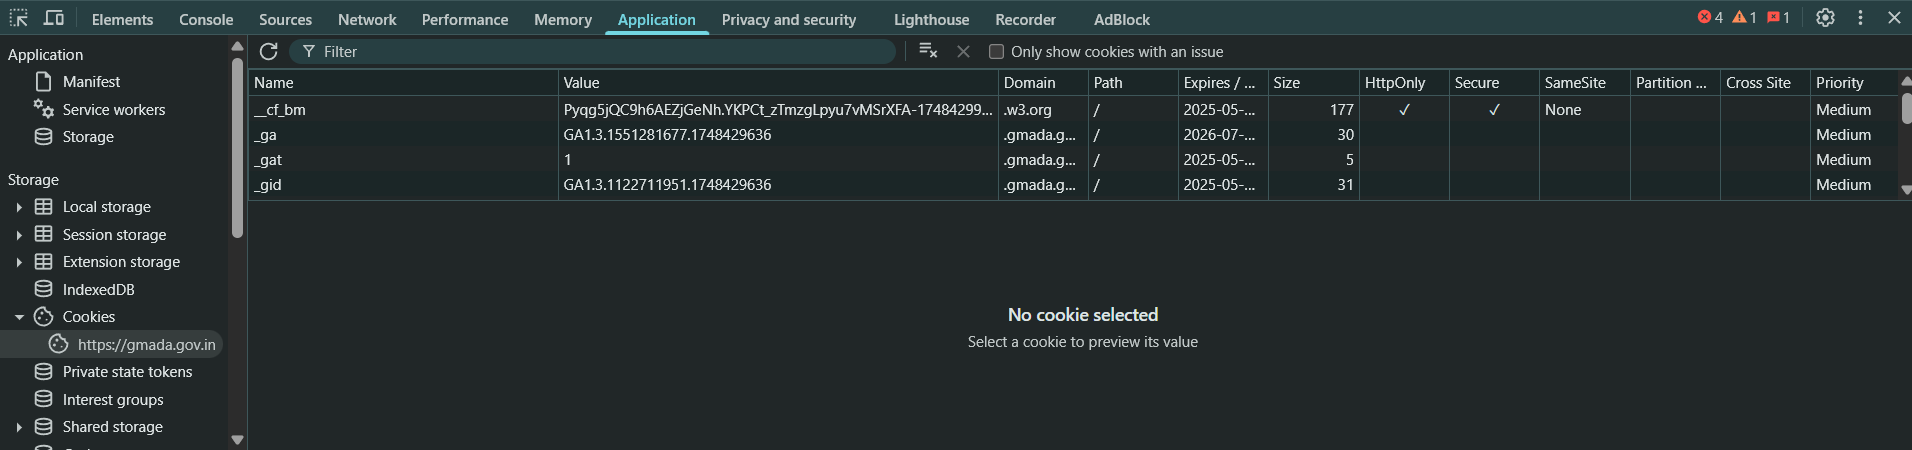
- What it does: View client-side data (cookies, localStorage, sessionStorage, IndexedDB, service workers).
- Use cases:
- Clear site data
- Test how your app handles stored data
- Inspect PWA service workers, cache
7. Security
-
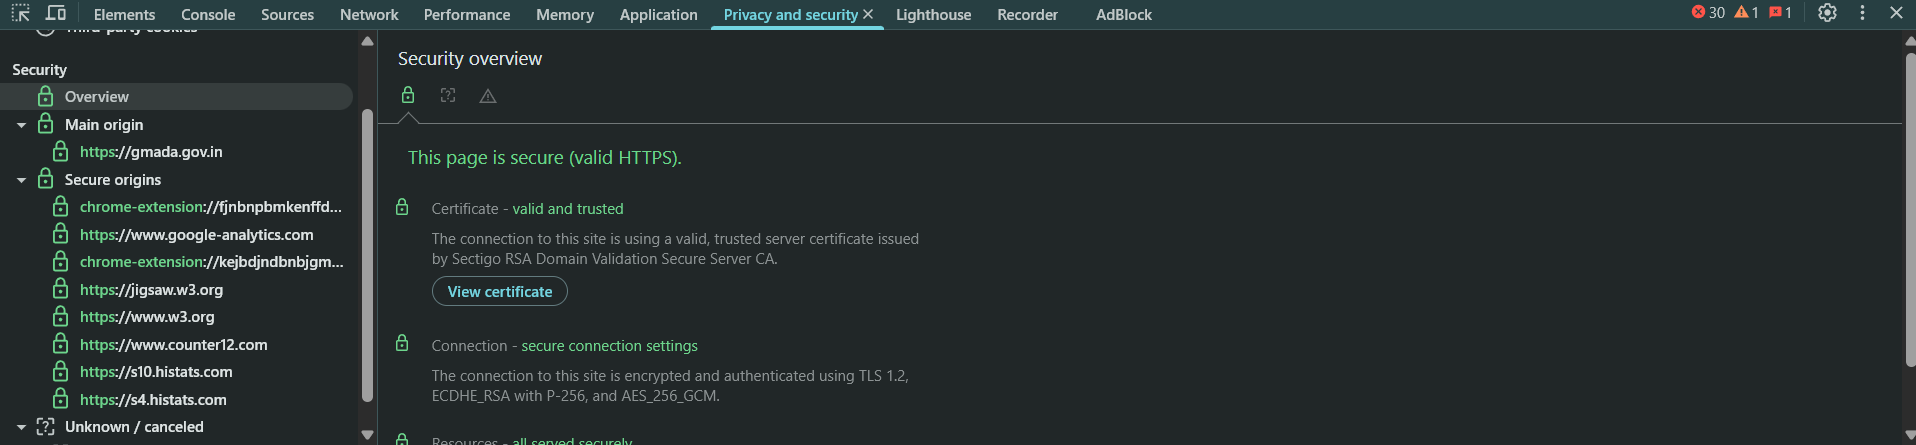
- What it does: Shows TLS/SSL info, certificate details, and mixed content warnings.
- Use cases:
- Ensure HTTPS
- Check for insecure resources
8. Lighthouse
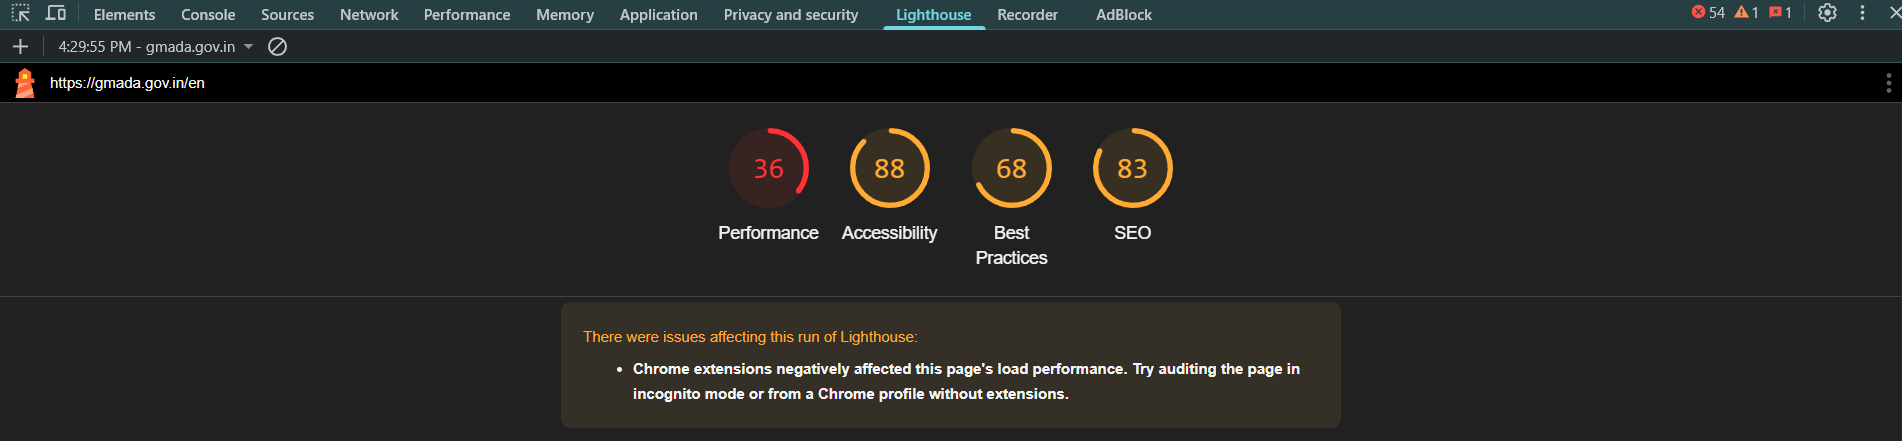
- What it does: Run audits for performance, accessibility, best practices, SEO, and PWA.
- Use cases:
- Analyze how to improve page speed
- Get a performance score
- See PWA readiness
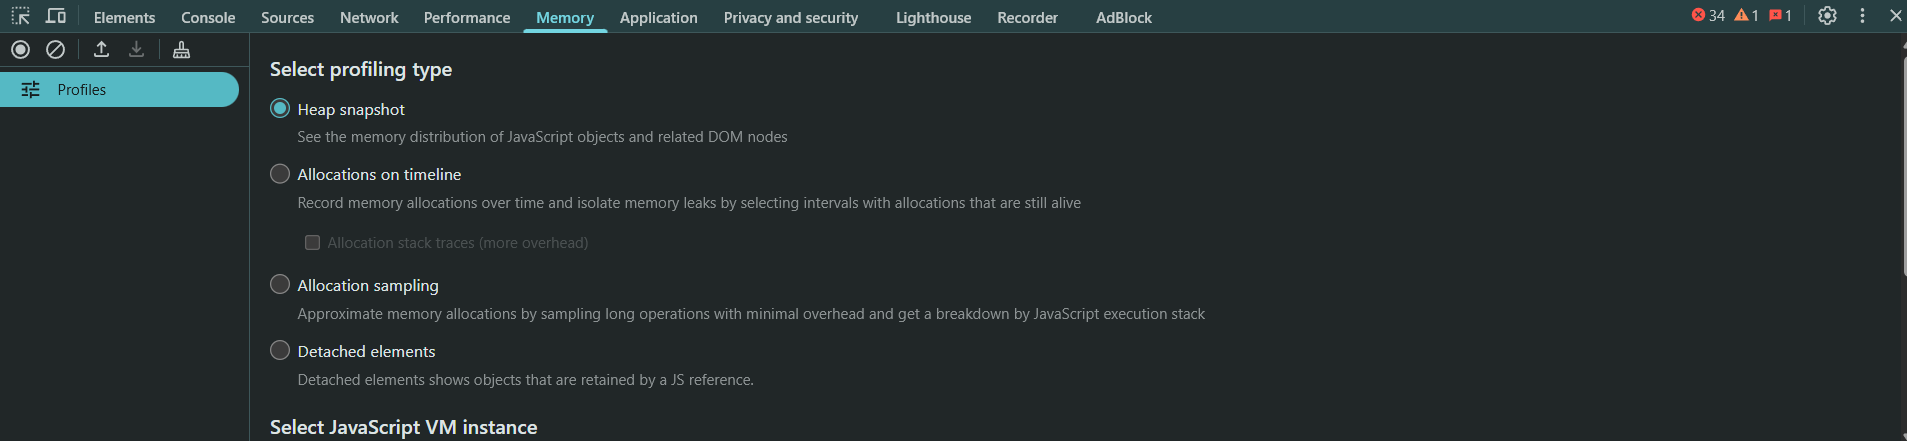
9. Memory
The Memory tab helps you:
- Detect memory leaks
- Monitor JavaScript heap usage
- Understand object allocations over time
- Analyze how long objects stay in memory
- Clean up your app to improve performance and responsiveness
Heap Snapshot
- Takes a snapshot of the memory heap.
- Lets you inspect which objects are in memory, how much memory they’re using, and what is keeping them from being garbage collected.
Good for:
- Finding memory leaks
- Identifying large or unexpected object allocations
- Analyzing retained size and object trees
Allocation Instrumentation on Timeline
- Records memory allocations over time with time correlation.
- Helps you see when and where memory was allocated.
Good for:
- Watching for growing memory use over time
- Spotting allocations tied to specific user actions
3. Allocation Sampling
- Takes samples of memory allocations.
- Lightweight and faster than full heap snapshot.
- Gives a general sense of which functions are allocating memory and how much.
Typical Workflow for Debugging Memory Leaks
Here’s how you’d typically use the Memory tab to find a leak:
Step 1: Take a Baseline Heap Snapshot
- Open the Memory tab.
- Select “Heap snapshot”.
- Click “Take snapshot”.
Step 2: Interact with the App
- Trigger the functionality that you think is leaking (e.g., opening a modal, adding a DOM node, using a component).
Step 3: Take Another Snapshot
- After performing the suspected action, take a second snapshot.
- Compare object counts and retained sizes with the first snapshot.
Step 4: Look for Detached DOM Trees or Unexpected Objects
- Search for “detached” in the snapshot.
- These are DOM elements that are no longer in the DOM tree but still in memory = memory leak!
- You can also look at “Retainers” to see what is holding references to leaked objects.
Step 5: Bonus Tips 🔧
- Use device toolbar (
Ctrl + Shift + M) to simulate mobile devices and test responsiveness. - Right-click →
Break on...to debug DOM changes (like deletions, modifications). - Use the Command Menu (
Cmd/Ctrl + Shift + P) for quick access to hidden features.
Step 6: Example Workflow: Let’s say you’re debugging a broken button click:
- Go to Elements, locate the button and check if it’s visible and not disabled.
- Switch to Console, log messages or check for JS errors.
- Use Sources to place a breakpoint in your click handler.
- Open Network to see if clicking sends a request.
- Use Application to ensure any necessary data is stored correctly (cookies, localStorage).
- Run a Lighthouse audit to check performance or accessibility.